The First Collection. More to Come.
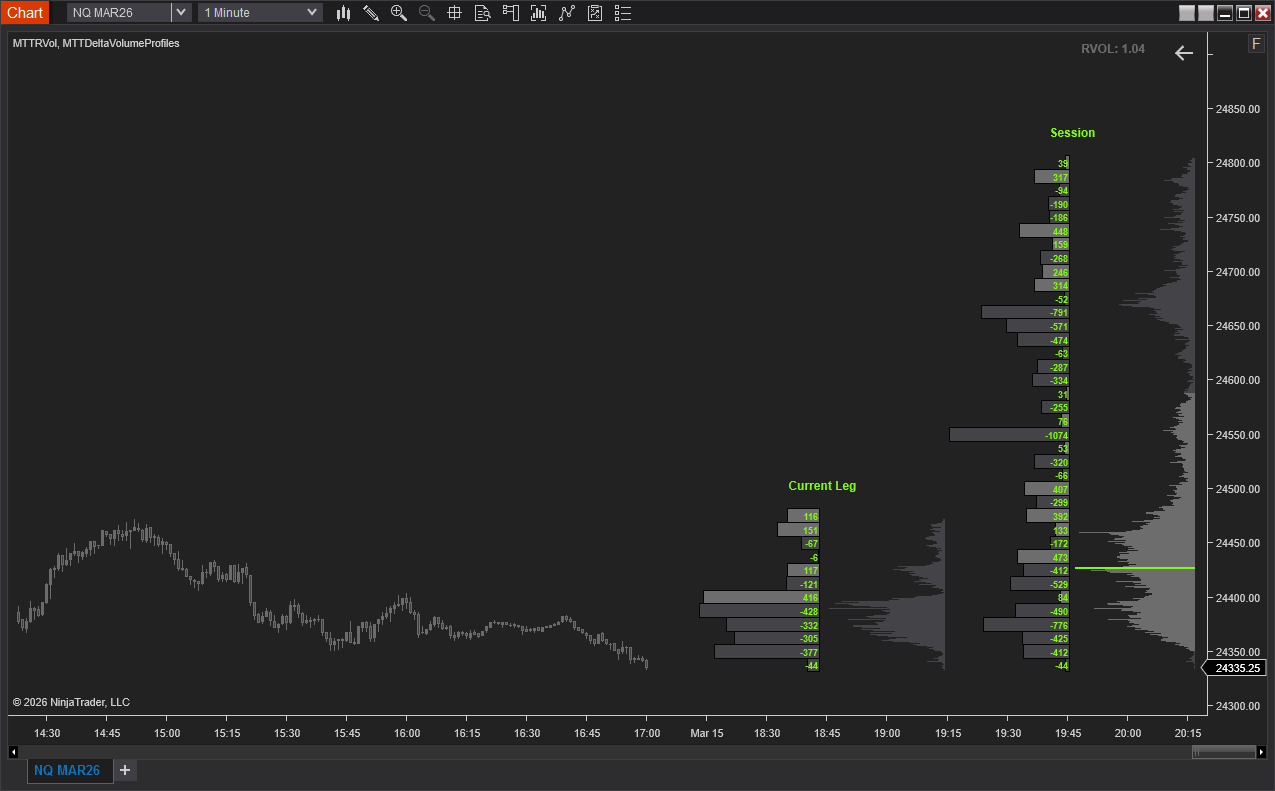
MTTDeltaVolumeProfiles
See exactly where buyers and sellers are fighting for control. This indicator gives you four profile views in one: session delta, session volume, leg delta, and leg volume, all auto-positioned side by side on the right edge of your chart. Session profiles show net buy/sell aggression and total volume at every price level for the current trading period. Configure up to 5 session reset times (EST) to get a clean read for overnight, pre-market, RTH, or any custom window. Leg profiles track the active price swing. When price reverses by your configured threshold, the indicator automatically detects the new leg, marks the reversal with a dot, and rebuilds the profiles from the swing point.
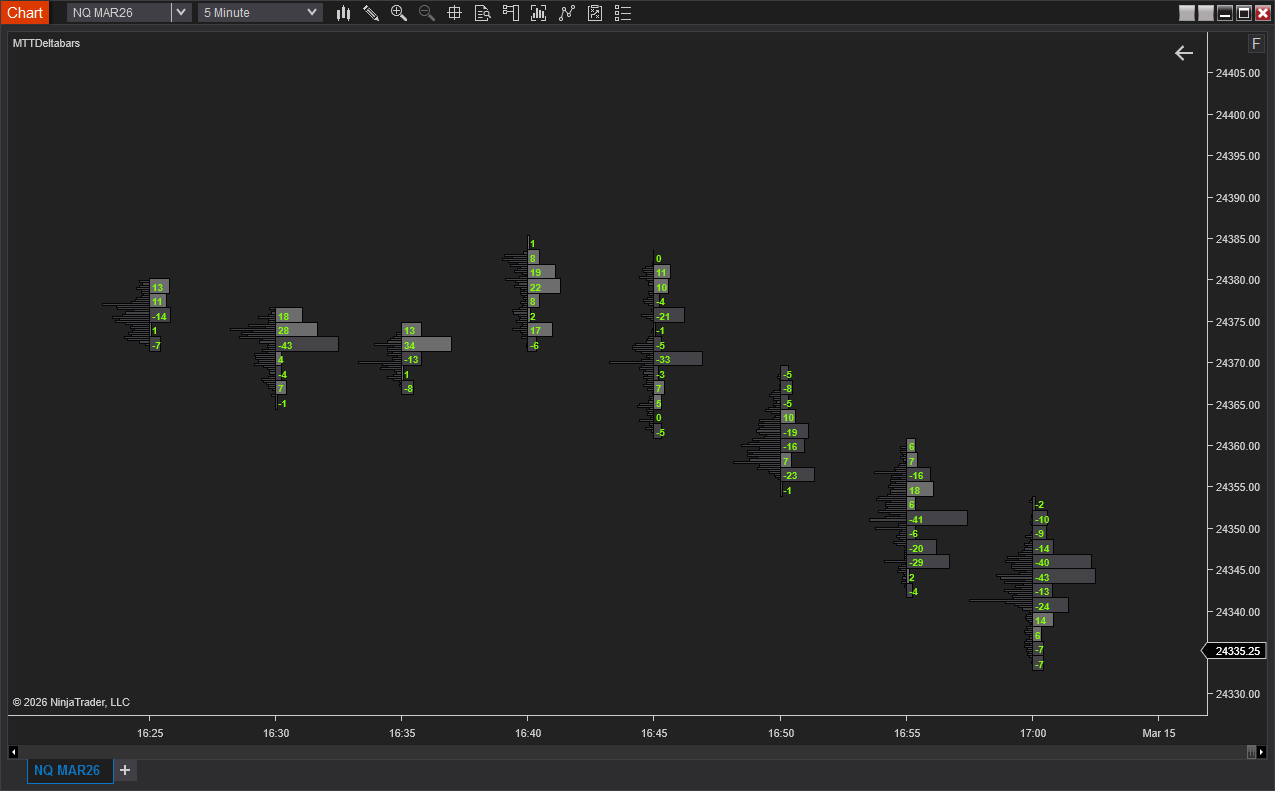
MTTDeltabars
Break open each candle to see the buy and sell battle happening inside. A delta profile at every price level within the bar, color-coded by aggressor side, shows instantly whether a bar was driven by real buying pressure or passive selling being absorbed. Pair it with the optional per-bar volume profile to see total volume concentration alongside the delta. Hide the chart candles entirely for a pure order flow view, or layer the profiles on top of your existing candles.
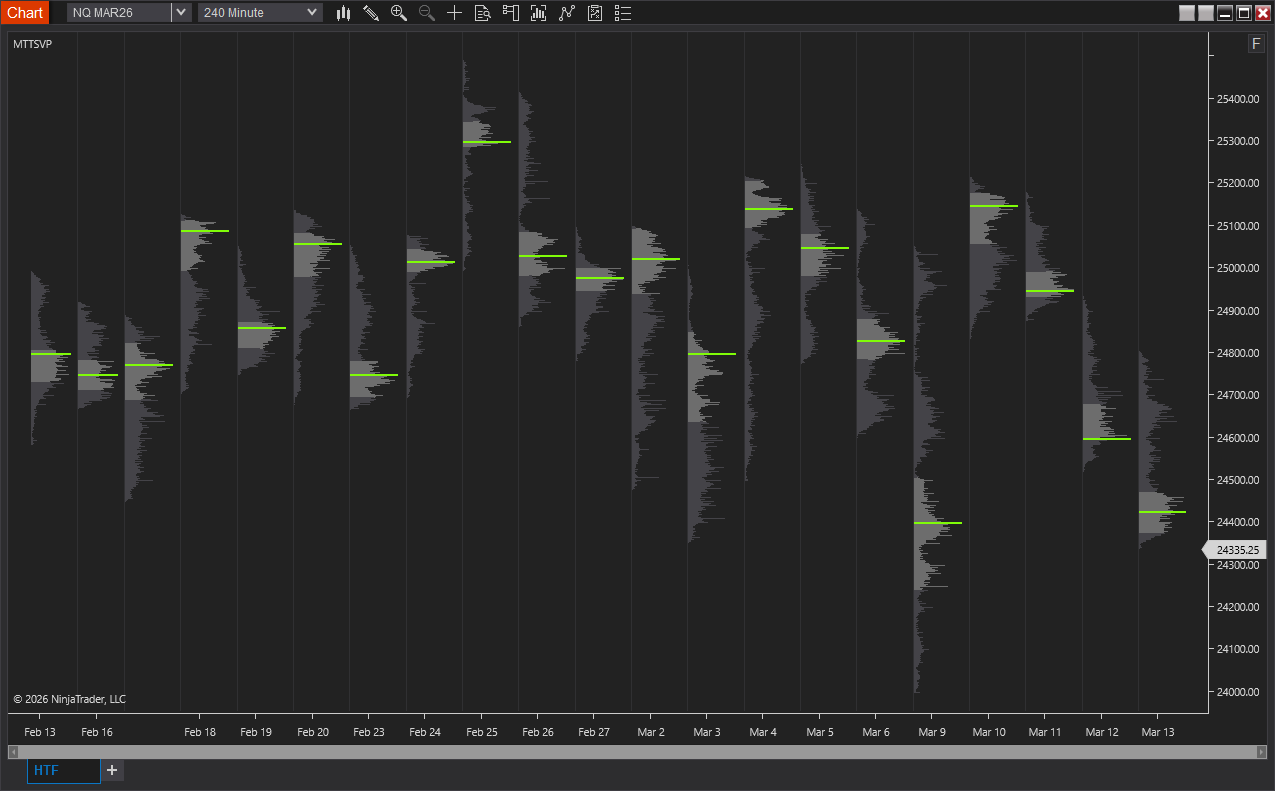
MTTSVP
Know where the market spent its time. MTTSVP draws a volume profile for each trading session directly on your chart, showing volume distribution, value area, and point of control at a glance. See multiple sessions side by side to quickly identify high and low-volume nodes, areas of support and resistance, and how today's auction compares to previous sessions. Hide candles for a clean profile-only view or overlay on top of your existing chart.
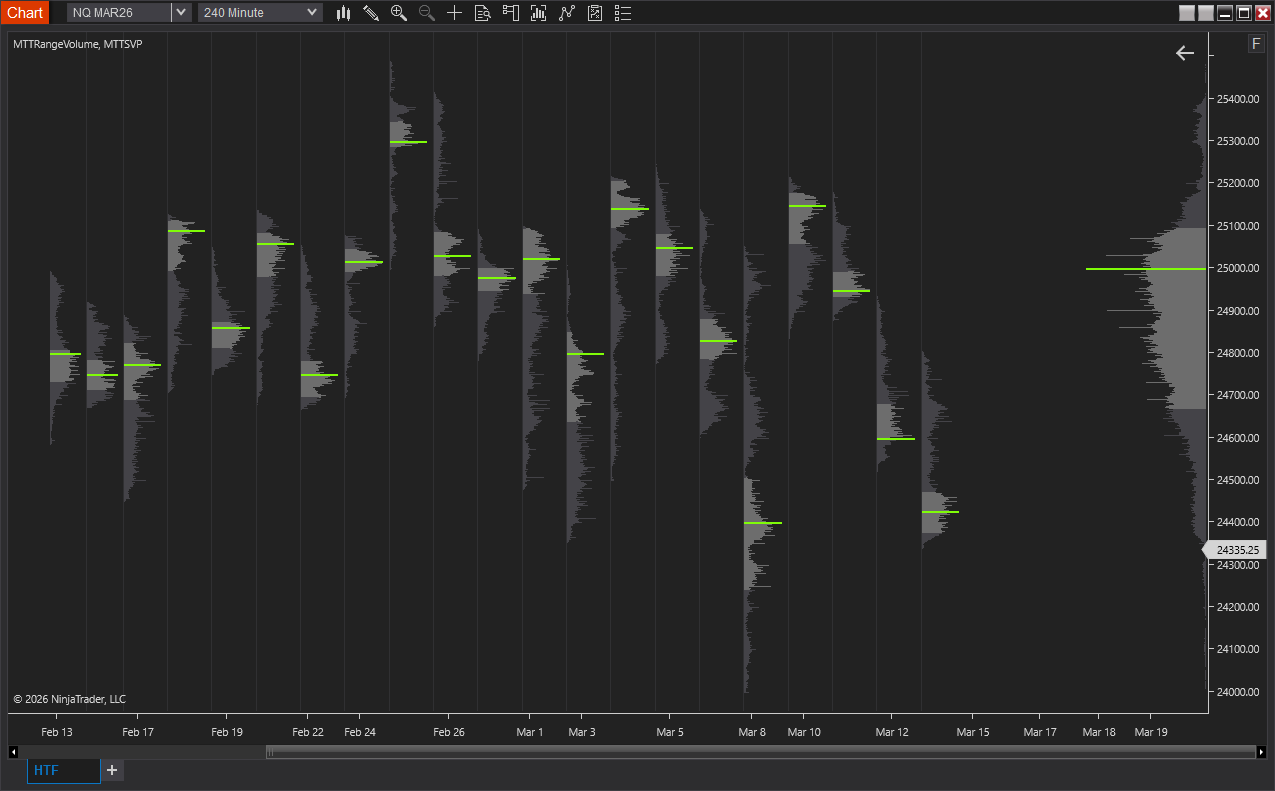
MTTRangeVolume
Get a bird's-eye view of volume at price across your chart. MTTRangeVolume builds a composite profile spanning a configurable lookback period, with highlighted value area and POC line. Spot the prices the market is accepting versus rejecting. Anchor the profile to the left or right side of the chart, and optionally hide candles for a clean volume map.
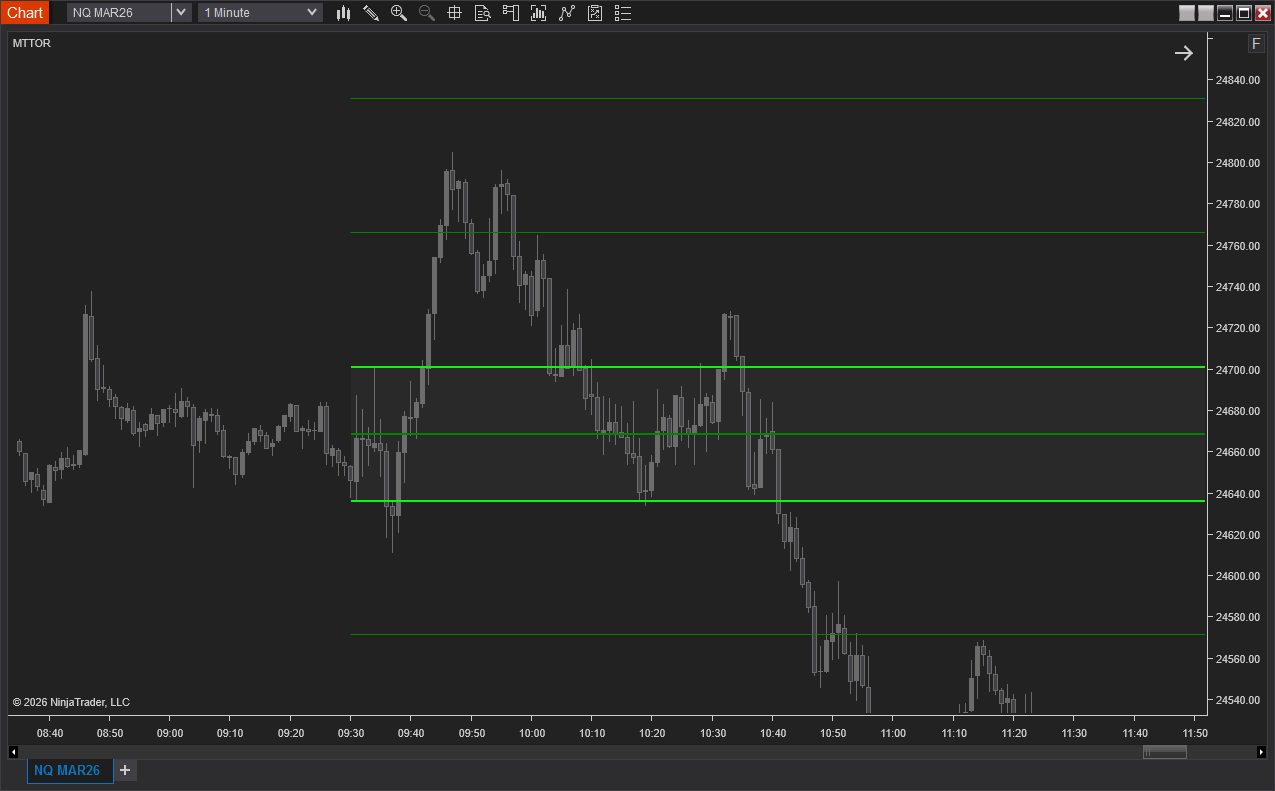
MTTOR
Never miss the opening range breakout. MTTOR plots the high, low, and midline for a customizable opening range of the regular session, then draws extension levels at configurable point intervals that appear automatically as price breaches each one. View multiple historical sessions to see how previous ranges played out relative to the day's action.
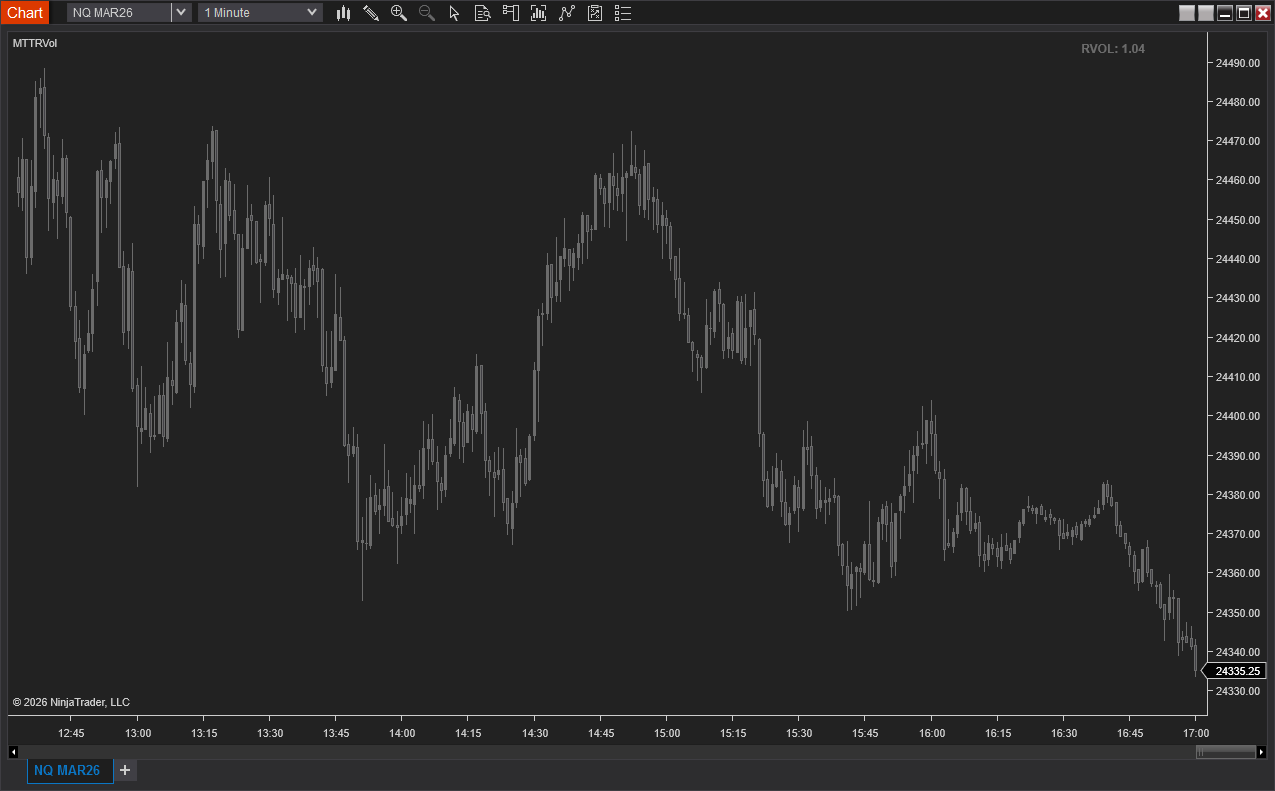
MTTRVol
Know if today's volume is running hot or cold, at a glance. MTTRVol compares the current session's cumulative volume against the historical average at the same time of day. The color-coded label changes dynamically: green when volume is running high, red when it's unusually low, and neutral in between. Set your own thresholds to match your trading style and the instruments you trade.
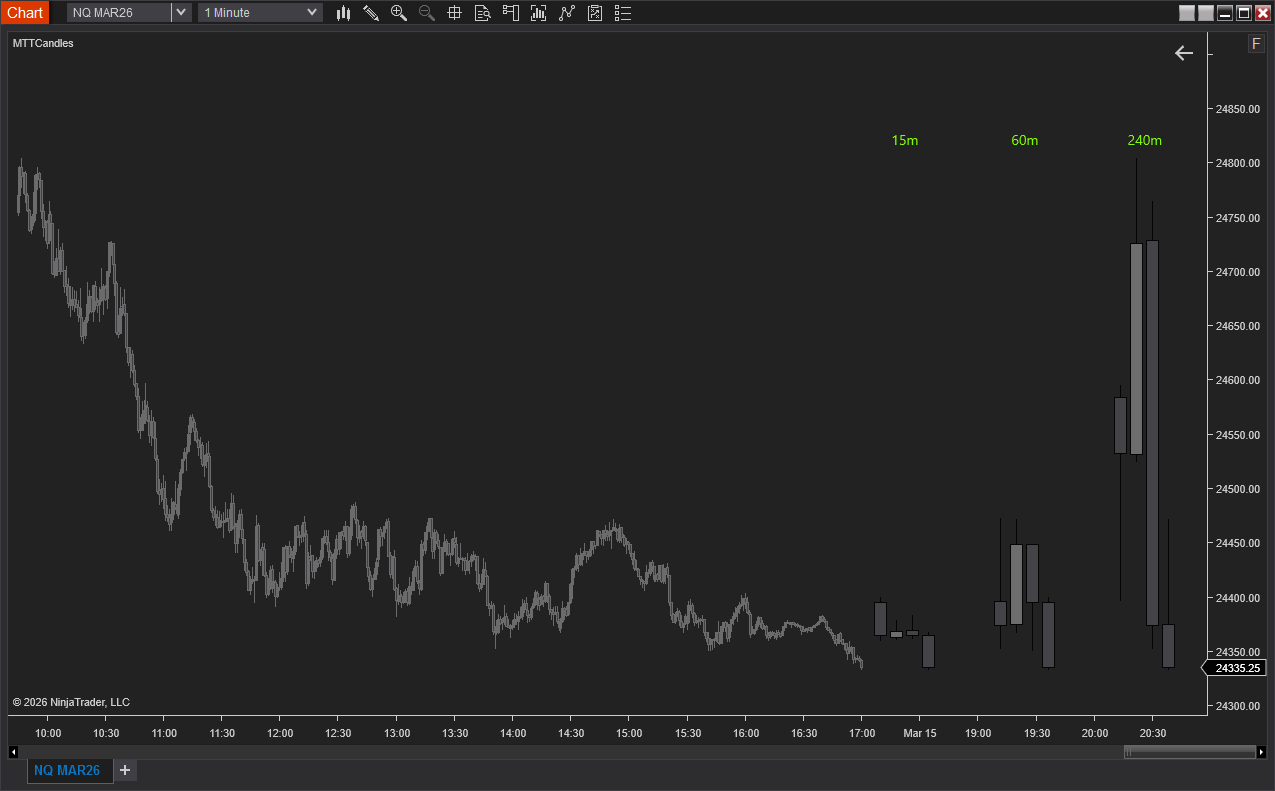
MTTCandles
Keep the bigger picture in view without switching charts. Three customizable timeframe groups render live candles directly on your chart. See at a glance whether the High-Timeframe candles align with your edge while staying focused on your execution timeframe. The rightmost candle in each group updates in real time with every tick. Position the groups relative to the right margin or anchor them to the last visible bar.